Storytelling with Data

Unlock the power of data and communicate complex ideas and Big data in a way that is engaging, informative, creative and accessible to everyone.
Projects

What does Singapore do differently?
Saying that Singapore is one of the best countries is one thing, but experiencing its exceptional Public transport system through visualization is truly eye-opening!
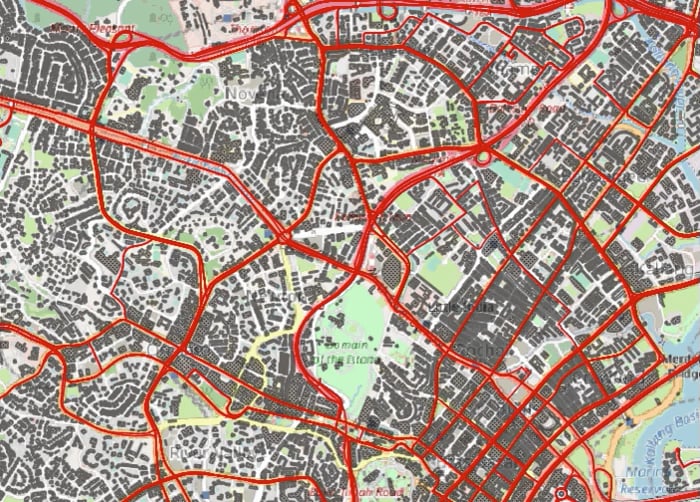
1 Hour of Public Transport in Singapore
Dynamic visualization of the movements of buses, metro, and trams during a typical weekday in Singapore
1 Hour of Public Transport in Dubai
Dynamic visulization of the movements of buses, metro trains, and trams during a typical weekday in Dubai
10 Years of Dubai Metro Ridership
The time Series visualizition display the yearly ridership of Dubai’s metro for the period 2010 -2021 using historical ridership data at Metro stations
Daily locations of earthquakes
Dynamic map below displaying the daily locations of earthquakes since the beginning of(1st January 2023- 7th February 2023)